
The Freight Rail Index (FRI) is an economic indicator designed to track the volume of freight rail traffic in the United States. The FRI includes data from both traditional carload commodities and intermodal containers and trailers, representing a comprehensive view of rail traffic. By focusing on economically sensitive freight, the FRI provides valuable insights into the activity levels of the freight rail sector, a crucial component of the broader transportation market and the U.S. economy.
Components of the FRI
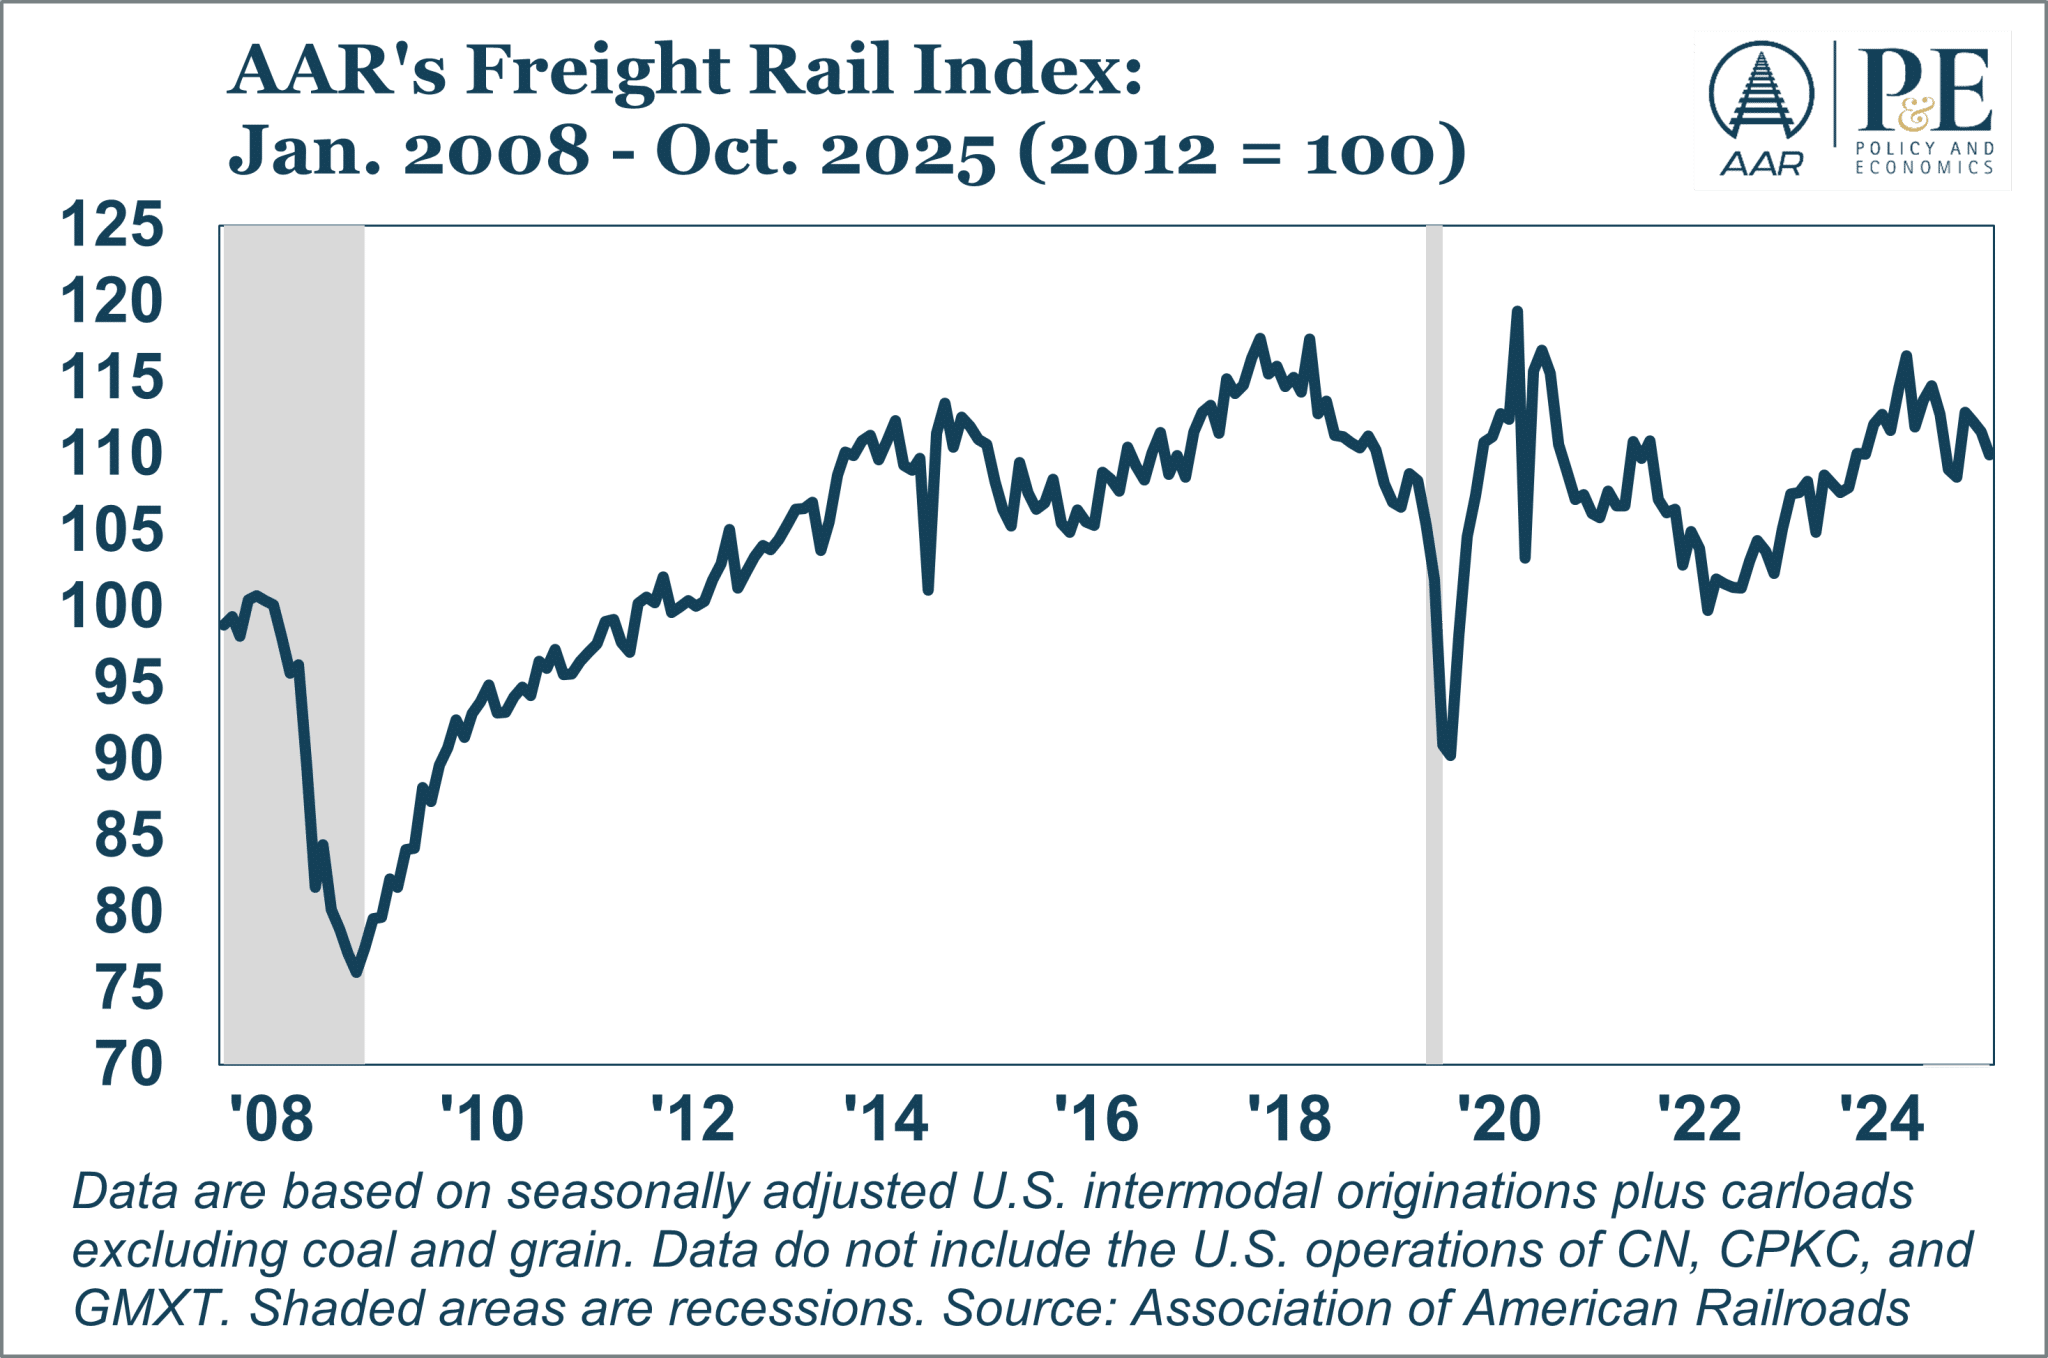
The FRI aggregates data on rail carloads and intermodal traffic but excludes coal and grain, which do not reflect general economic conditions. The index includes 18 carload commodity categories and intermodal containers and trailers, collectively referred to as “economically sensitive freight.”
- Carload Commodities: These are goods shipped in various types of rail cars, such as hopper cars, tank cars, gondolas, and boxcars, and include agricultural products, chemicals, metals, and many other bulk goods.
- Intermodal Traffic: This segment involves the long-haul movement of shipping containers and truck trailers by rail, combined with truck or water movements at one or both ends. A container counts as one unit regardless of its size. Commodity details inside containers and trailers are unavailable, but intermodal is included in FRI due to its sensitivity to economic shifts.
- While intermodal units typically carry less volume than traditional carloads, AAR does not apply weighting in the FRI calculation. Unlike traditional carloads that transport bulk commodities like coal, grain, or chemicals, intermodal often consists of higher-value goods such as consumer products, electronics, and automotive parts.
- This shift toward diversified, high-value, and time-sensitive freight reflects a strategic evolution in the industry. Weighting intermodal down to account for its lower physical volume would ignore this important shift and undervalue intermodal’s impact on supply chains and the economy. The FRI is designed to capture overall rail activity levels, emphasizing the frequency and economic significance of movements rather than focusing on physical weight or tonnage, which are addressed by other metrics.
Exclusion of Coal & Grain
Coal and grain are excluded from the FRI because their rail traffic volumes are driven mainly by factors unrelated to overall U.S. economic conditions, such as natural gas prices, environmental regulations (coal), weather, and export levels (grain).
Relationship to Economic Indicators
Historically, rail activity and GDP tend to move in tandem. An increase in rail traffic usually signals positive economic momentum, reflecting higher consumer spending, robust manufacturing activity, and overall economic growth.
Conversely, a decline in the FRI may indicate an economic slowdown, particularly on the goods-side of the economy. By focusing on this subset of rail transportation, the FRI serves as a key indicator for policymakers, economists, and business leaders, offering a window in the direction of the broader economy.
Creation of the FRI
Data Collection & Traffic Sources
- The FRI uses traffic data provided by participating U.S. railroads, including BNSF, CSX, Norfolk Southern (NS), Union Pacific (UP), Lake Superior and Ishpeming, and Paducah & Louisville. These railroads collectively account for the vast majority of U.S. rail volumes.
- Data collection covers a one-week period from Sunday to Saturday. Monthly figures are derived by assigning each week to a specific month, depending on where the majority of the week’s days fall. Some months will therefore have four weeks, while others have five.
- To enable consistent month-to-month comparisons, weekly averages are used to normalize the traffic data.
Exclusion Criteria
- CN, CPKC, and GMXT also report their traffic data to the AAR, but it is not possible to separate the U.S. from their non-U.S. traffic. The AAR compiles and publishes North American rail traffic data that include these railroads, but they are not included in FRI.
- Historical adjustments ensure data consistency by excluding contributions from railroads no longer aligned with the current participating entities, such as pre-merger Kansas City Southern (KCS) data.
Calculation Methodology
- Aggregation of Weekly Data
- FRI values are calculated by aggregating the weekly volumes of economically sensitive freight starting from January 2008 to the most recent week available.
- The monthly FRI is computed by averaging the weekly totals within each month. If the month has four weeks, the sum of the weekly traffic is divided by four; if five weeks, by five. This same approach applies to quarterly totals.
- Seasonal Adjustment
- Data are seasonally adjusted at the commodity level using the X-13 ARIMA-SEATS program to ensure the index reflects the true underlying trends rather than seasonal patterns. Seasonal adjustments are updated as the program is refined.
- Data Consistency & Accuracy
- To avoid double counting, only originated movements are included in the FRI.