KEY FACTS
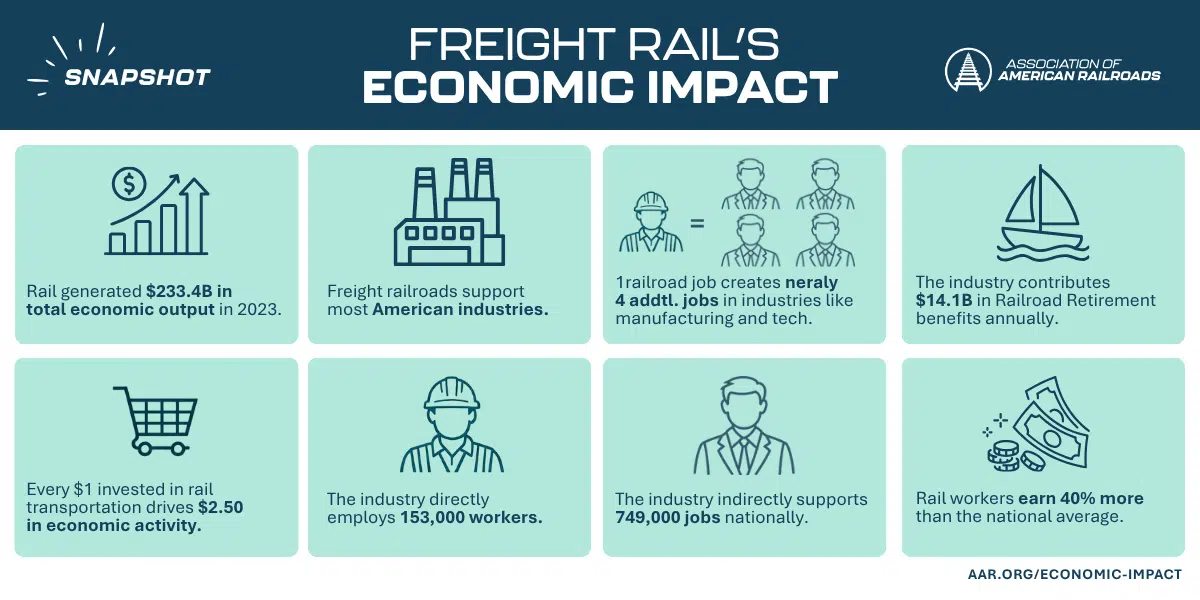
- Every $1 invested in rail transportation drives $2.50 in economic activity.
- Every railroad job creates 3.9 additional jobs in industries like manufacturing, logistics and tech.
- Privately funded rail infrastructure saves taxpayers while powering trade and industry nationwide.
Rail transportation is a cornerstone of the U.S. economy. It powers industries, drives trade, and supports high-wage jobs. Freight rail’s private network eases pressure on taxpayer-funded roads. From bulk commodities to intermodal freight, rail moves goods efficiently across the nation and into global supply chains.
By the Numbers
A report from AAR’s Policy & Economics team quantifies rail transportation’s economic impact, examining its contributions to jobs, trade, private investment, and public benefits:
- Rail is a major driver of economic activity, generating $233.4 billion in total economic output in 2023.
- In 2023, Class I railroads reinvested $26.8 billion in modernizing infrastructure, enhancing safety and improving reliability.
- Every $1 invested in rail transportation drives $2.50 in economic activity.
- Every railroad job creates 3.9 additional jobs in industries like manufacturing, logistics and technology.
- The industry directly employs 153,000 workers, but its total employment impact is far greater — supporting 749,000 jobs nationwide through supply chains and consumer spending.
- Rail workers earn 40% more than the national average, and the industry contributes $14.1 billion in Railroad Retirement benefits annually, reinforcing economic stability.
Public Benefits: Sustainability, Efficiency, and Cost Savings
Rail provides far-reaching public benefits, improving supply chain efficiency, reducing environmental impact, and easing pressure on infrastructure.
- Fuel Efficiency: On average, rail moves one ton of freight nearly 500 miles per gallon of fuel. It is three to four times more fuel efficient than trucks, on average.
- Lower Emissions: Reduces greenhouse gas emissions by up to 75% compared to trucking.
- Highway Congestion Relief: A single train removes hundreds of trucks from the highway. This cuts traffic congestion, fuel costs, and road wear-and-tear.
- Infrastructure Cost Savings: Railroads own, operate, and maintain their networks, reducing the need for taxpayer-funded highway expansion.
State-Level Contributions: Rail’s Broad Economic Footprint
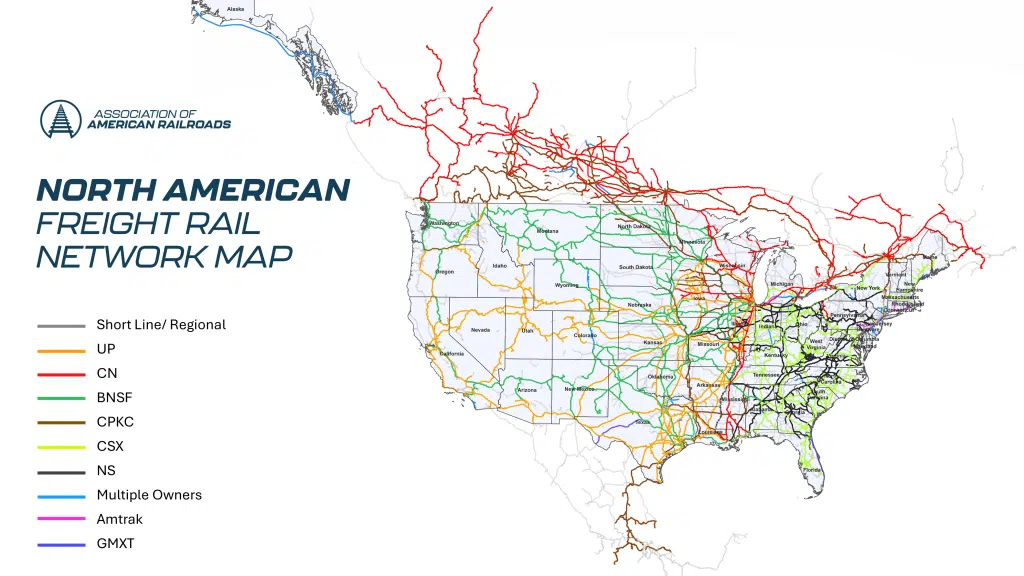
Freight rail supports high wage jobs and anchors key trade corridors across the U.S. The top five states for freight rail employment are Texas, Illinois, Nebraska, California, and Georgia. This reflects rail’s deep economic integration into industries like agriculture, energy, and manufacturing.
THE BOTTOM LINE
Freight rail is a major driver of the U.S. economy, generating billions in economic output, supporting hundreds of thousands of jobs, and strengthening industries nationwide. By moving goods efficiently and investing heavily in infrastructure, rail helps boost productivity, reduce costs, and support long-term economic growth.