
RIO is a free monthly publication that provides insights from our economists into what rail traffic says about today’s economy and where the data suggests it could be headed. As part of RIO, the Freight Rail Index (FRI) tracks movement across the most economically sensitive rail traffic commodities.
You can find the full report each month on this webpage, with past editions available as PDFs at the bottom of the page. You can sign up for our email newsletter above to have RIO delivered directly to your inbox. For a deeper analysis, subscribe to our Rail Time Indicators (RTI) report.
Find past edition PDFs at the bottom of this page.
April 2026 Key Takeaways
- Carloads Strengthen. Up 1.7% YoY in March, the third straight gain. Growth is broad-based, led by grain and record‑level chemicals. YTD up 4.2%, best start since 2019.
- Intermodal Stabilizing. Up 1.4% YoY, second consecutive increase. After a long normalization, downside pressure is easing and momentum is turning.
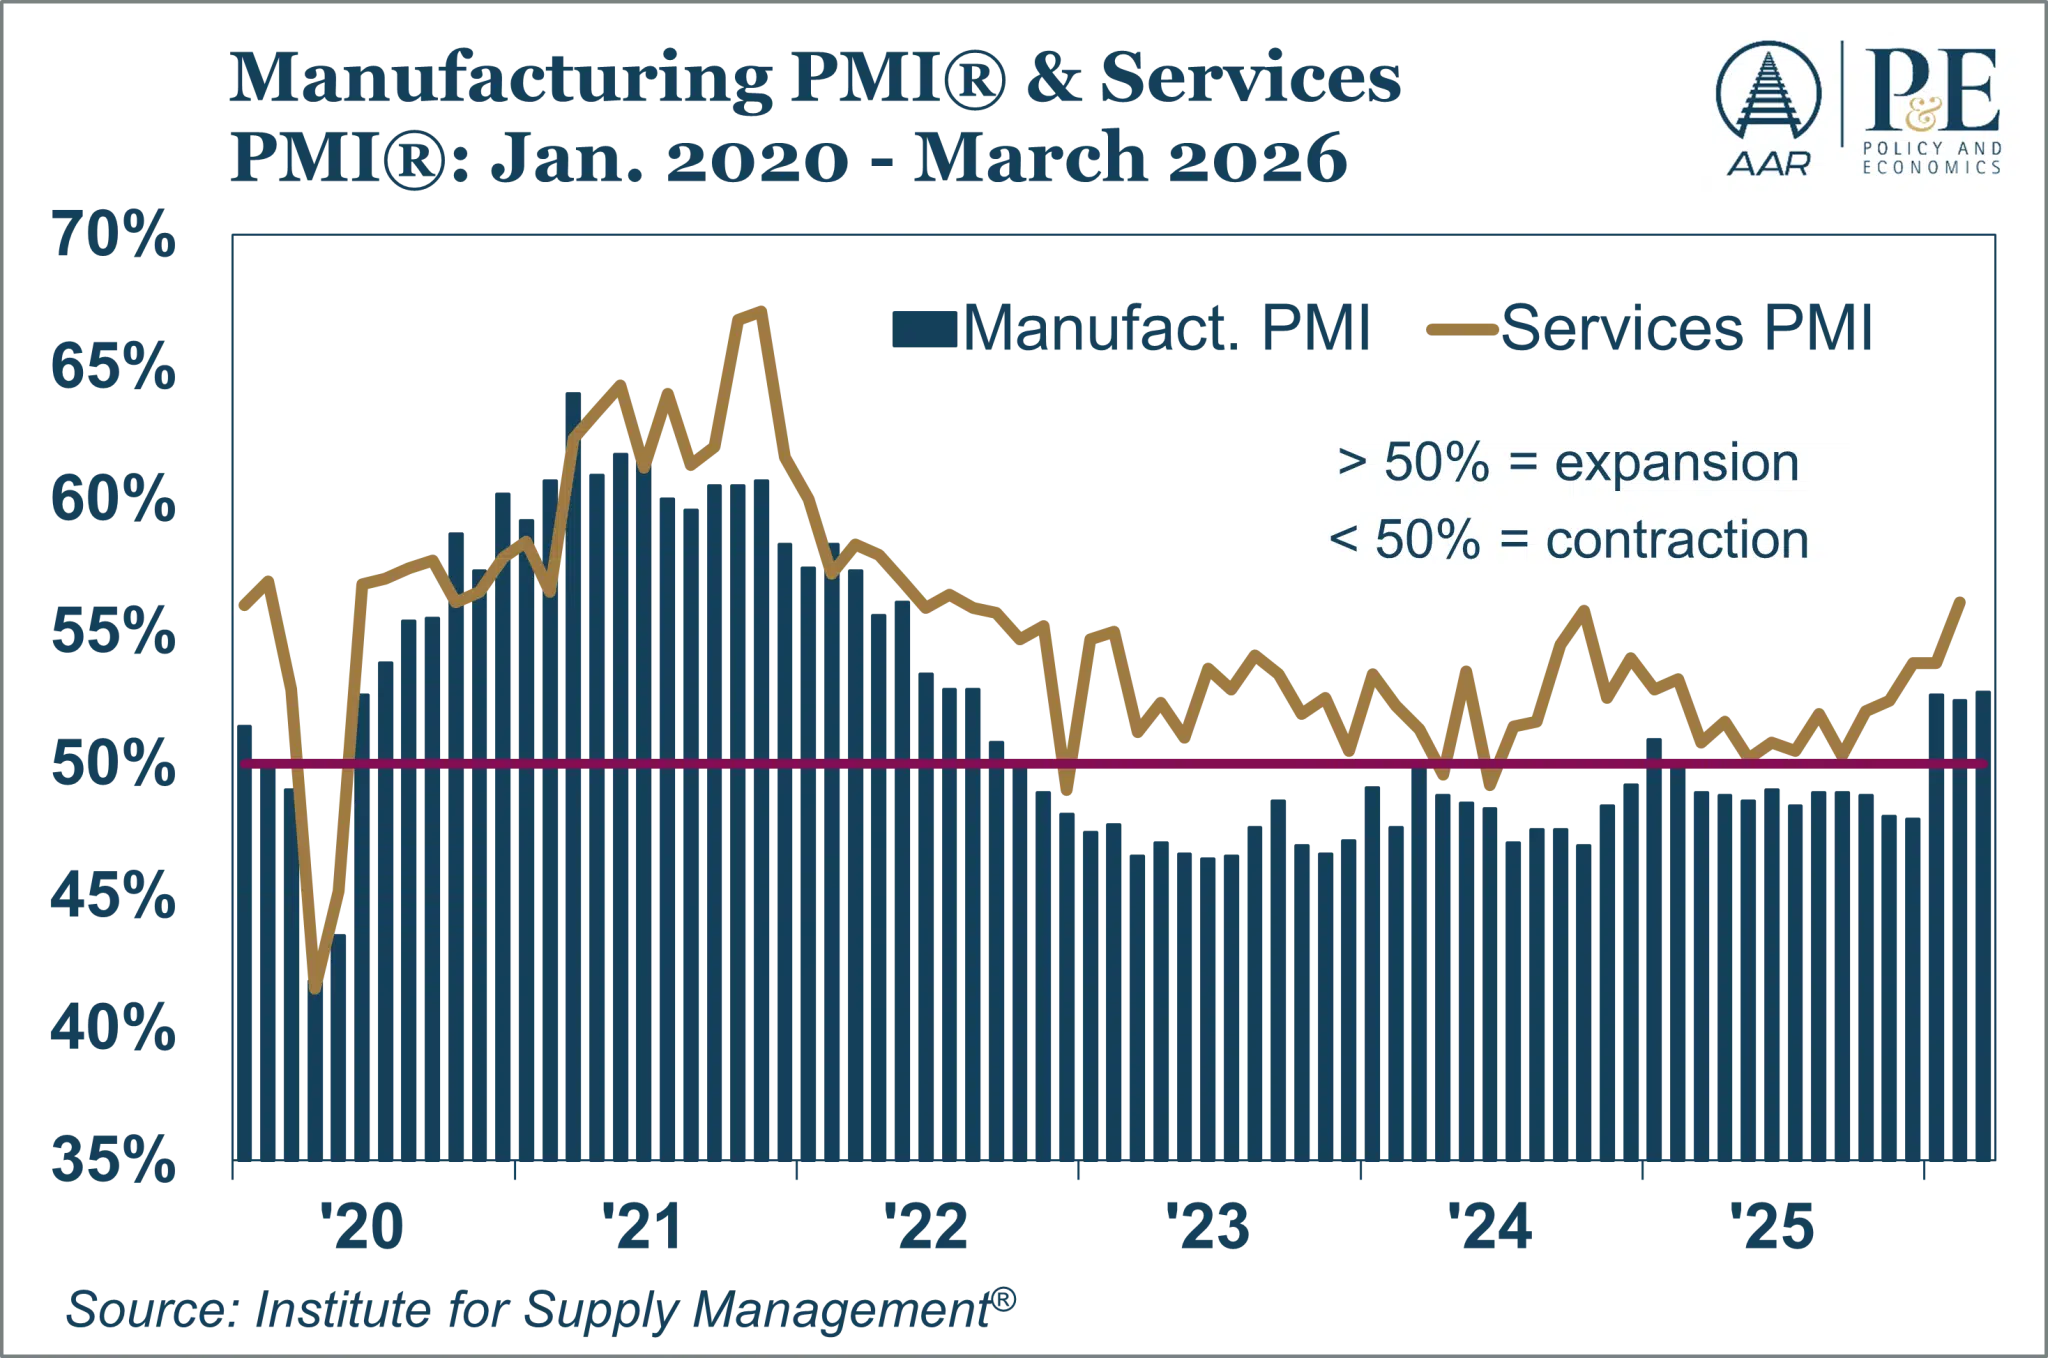
- Manufacturing Improving. PMI® above 50% for three straight months, signaling a return to expansion after two years of uneven output.
- Labor Cooling, Not Cracking. March job growth surprised to the upside and unemployment edged lower. Layoffs remain low, pointing to moderation rather than deterioration.
Momentum Amid Crosscurrents
Railroads sit at the intersection of production, trade, and energy, and in March, that intersection became noticeably busier.
U.S. freight rail traffic posted some of its strongest readings in years, offering one of the clearest signals yet that the goods economy is regaining its footing. Volumes are not simply rising in one corner of the network; they are firming across agriculture, industrial inputs, chemicals, and intermodal corridors that link U.S. consumers to global supply chains.
At the same time, this momentum is unfolding against a complicated macro backdrop. Energy markets remain sensitive to geopolitical risk, inflation remains sticky, and labor market signals are increasingly mixed. Rail traffic, in this environment, is telling a familiar but important story: activity is improving, but the margin for error remains thin.
A Broad-Based Pickup, Not a One-Off Bounce
March 2026 marked a turning point in rail volumes.
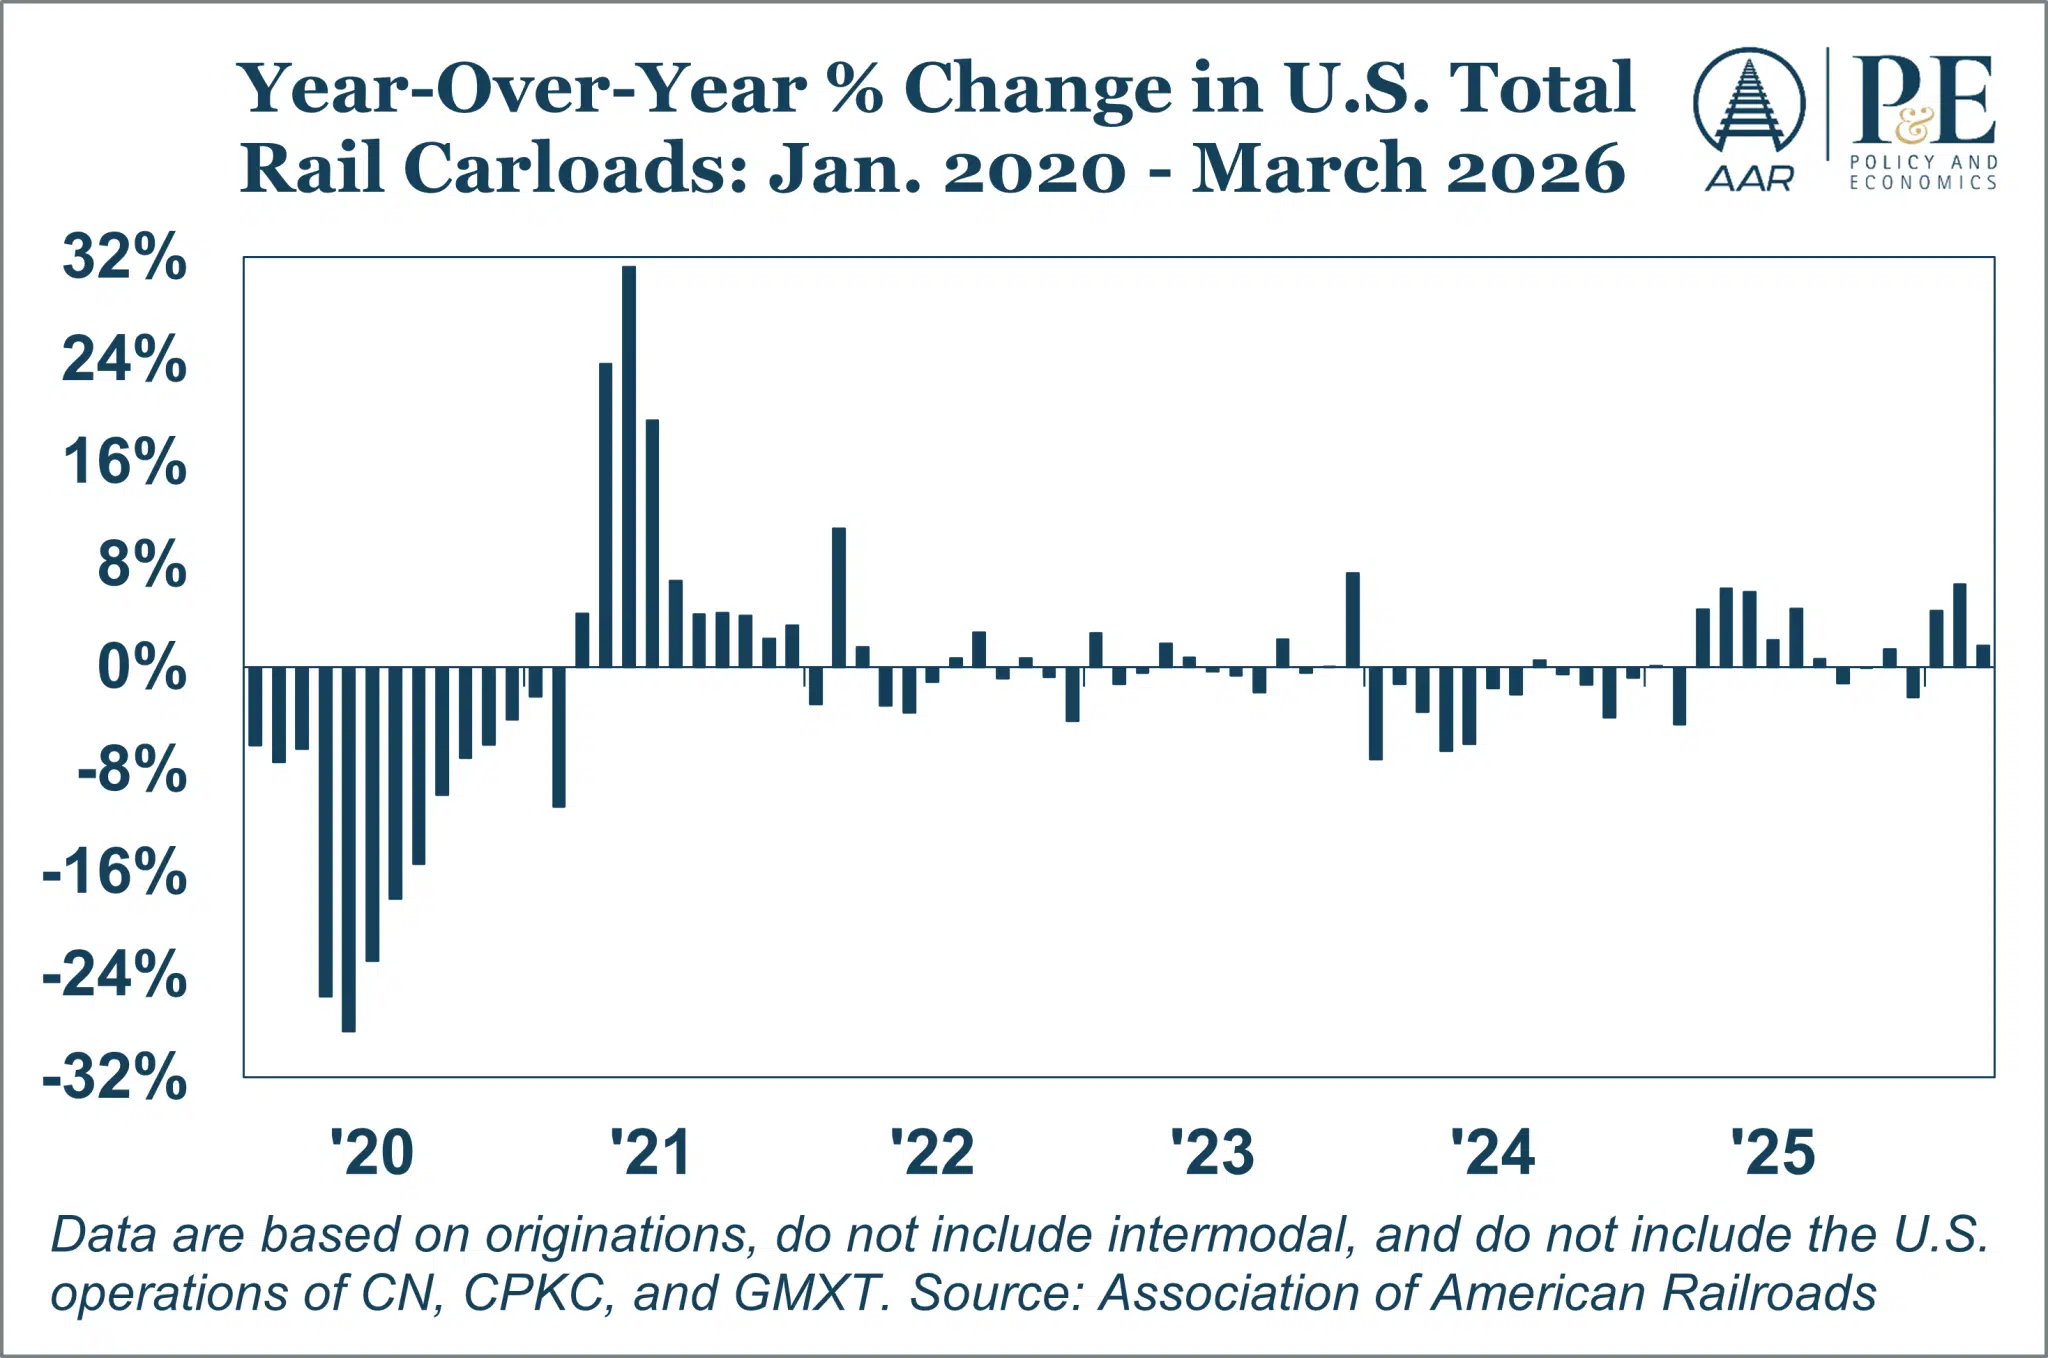
Total U.S. rail carloads averaged 230,401 per week, the strongest March result since 2019 and the highest monthly average since October 2022. Carloads rose 1.7% year-over-year, extending the recovery to a third consecutive monthly increase. For the first quarter, carloads totaled 2.68 million, up 4.2% from last year and the strongest first-quarter performance since 2019.
What matters most is not just the level of activity, but its breadth.

Twelve of the 20 major carload categories posted year-over-year gains in March, continuing a trend that has now been in place since January. That breadth points to a stabilization in the underlying goods economy, rather than a rebound driven by temporary restocking or activity concentrated in a single sector.

Intermodal traffic reinforces the same message. U.S. intermodal originations averaged 280,076 units per week in March, the second-highest March level on record and up 1.4% from a year earlier. While year-to-date intermodal volumes remain slightly below last year’s unusually strong levels, March’s improvement highlights the resilience of consumer-linked freight flows and the ongoing role of rail in long-haul domestic logistics.
Taken together, these trends suggest that the economy is moving away from the narrow, uneven growth patterns that dominated much of the past two years and toward a more durable, if still fragile, expansion in goods-related activity.
FRI Signals Underlying Strength, Despite a Monthly Pause
The AAR Freight Rail Index (FRI), which captures rail traffic most sensitive to broader economic conditions, provides an important lens on whether current momentum is cyclical or structural.
The index edged down 0.3% in March after two months of gains. On the surface, that pullback looks cautious. In context, it is constructive.
Average FRI levels in the first quarter reached their highest level in nearly five years, consistent with steady expansion in freight-intensive sectors such as manufacturing, construction inputs, and export-oriented production. Short-term volatility in the index often reflects timing effects or weather-related shifts rather than changes in direction. Viewed as a leading indicator, the FRI suggests that the recovery in rail traffic is not backward-looking, but rather it reflects activity that is still working its way through production pipelines and supply chains.
What’s Moving—and Why It Matters
Grain and Grain Products: Rail at the Center of Global Food Flows
Grain was the single largest contributor to March’s growth.
U.S. railroads originated more than 97,000 carloads of grain in March, up 10.3% from a year earlier. First-quarter grain volumes reached their highest level for any first quarter since 1993, supported by strong export demand and steady global consumption.
Grain mill products also remained elevated, averaging nearly 10,700 carloads per week, up 6.2% year over year. Biofuel production continues to play a central role here, driving grain processing, supporting rural investment, and generating rail-dependent co-products that move efficiently over long distances.
In a world where geopolitical tensions continue to shape global food security, grain traffic underscores rail’s role as strategic infrastructure, connecting U.S. agricultural output to global markets.
Chemicals: A Quiet Signal of U.S. Industrial Competitiveness
Chemical shipments remain one of the clearest indicators of industrial health, and they continue to outperform.
March chemical volumes reached a record weekly average of 35,580 carloads, up 5.5% year over year. First-quarter volumes were the highest on record.
This strength reflects the relative competitiveness of U.S. chemical producers, supported by advantaged domestic natural gas prices that provide both energy and feedstock. Unlike gasoline and diesel prices, U.S. natural gas prices did not spike in March.** As global manufacturers continue to reassess supply chains, chemicals moving by rail point to sustained domestic production and export demand.
** Natural gas prices spiked in late January and early February 2026 because an intense Arctic storm drove U.S. heating demand sharply higher at the same time that widespread wellhead and gathering‑system freeze‑offs knocked a big chunk of U.S. natural gas production offline. The combination of surging demand and temporarily curtailed supply kept prices high into early February, when temperatures moderated and production recovered. This price spike came before the Iran conflict.
Together, grain and chemicals tell a consistent story: this is not just a domestic rebound, but one linked to U.S. competitiveness in global commodity and industrial markets.
Steel and Coal: Structural Change Beneath Stable Volumes
Steel-related traffic remains mixed, reflecting longer-term shifts more than cyclical weakness.
Carloads of primary metal products declined 8.7% in March, largely due to reduced long-haul movements tied to sharply lower steel imports. At the same time, shipments of iron and steel scrap rose 2.6%, continuing the steady transition toward electric-arc furnace steelmaking, which relies more heavily on recycled inputs.
Coal remains the largest drag on total carloads but shows signs of stabilization. March coal loadings totaled 236,000 carloads, down 1.5%, yet average weekly volumes were the highest in six months. Year-to-date coal volumes are up 3.3%.
Coal accounted for 16.6% of U.S. electricity generation in 2025, and rail continues to move more than 70% of coal shipments, underscoring its ongoing role in energy reliability even amid long-term transition.
The Core Signal: Carloads Excluding Coal
Perhaps the clearest read on the goods economy comes from carloads excluding coal.
In March, these averaged 171,338 per week, the strongest March level since 2008 and the highest monthly level since August 2019. Year-to-date volumes are up 4.5% and at their highest level since 2015.
This segment strips out energy volatility and provides a cleaner view of industrial, agricultural, and consumer-linked freight. Current levels point to stabilization and renewed momentum, conditions that typically precede expansions rather than contractions.
Macro Backdrop: Supportive, but Not Without Risk
Manufacturing is improving. Output rose 1.3% year over year in February, and the ISM Manufacturing PMI® reached 52.7% in March, its highest reading in more than three years. If sustained, this trend would provide broad-based support for rail across multiple commodity groups.
The service sector remains solid, reinforcing demand through consumer and business activity that is critical for intermodal and finished goods movements.
The risks lie elsewhere.
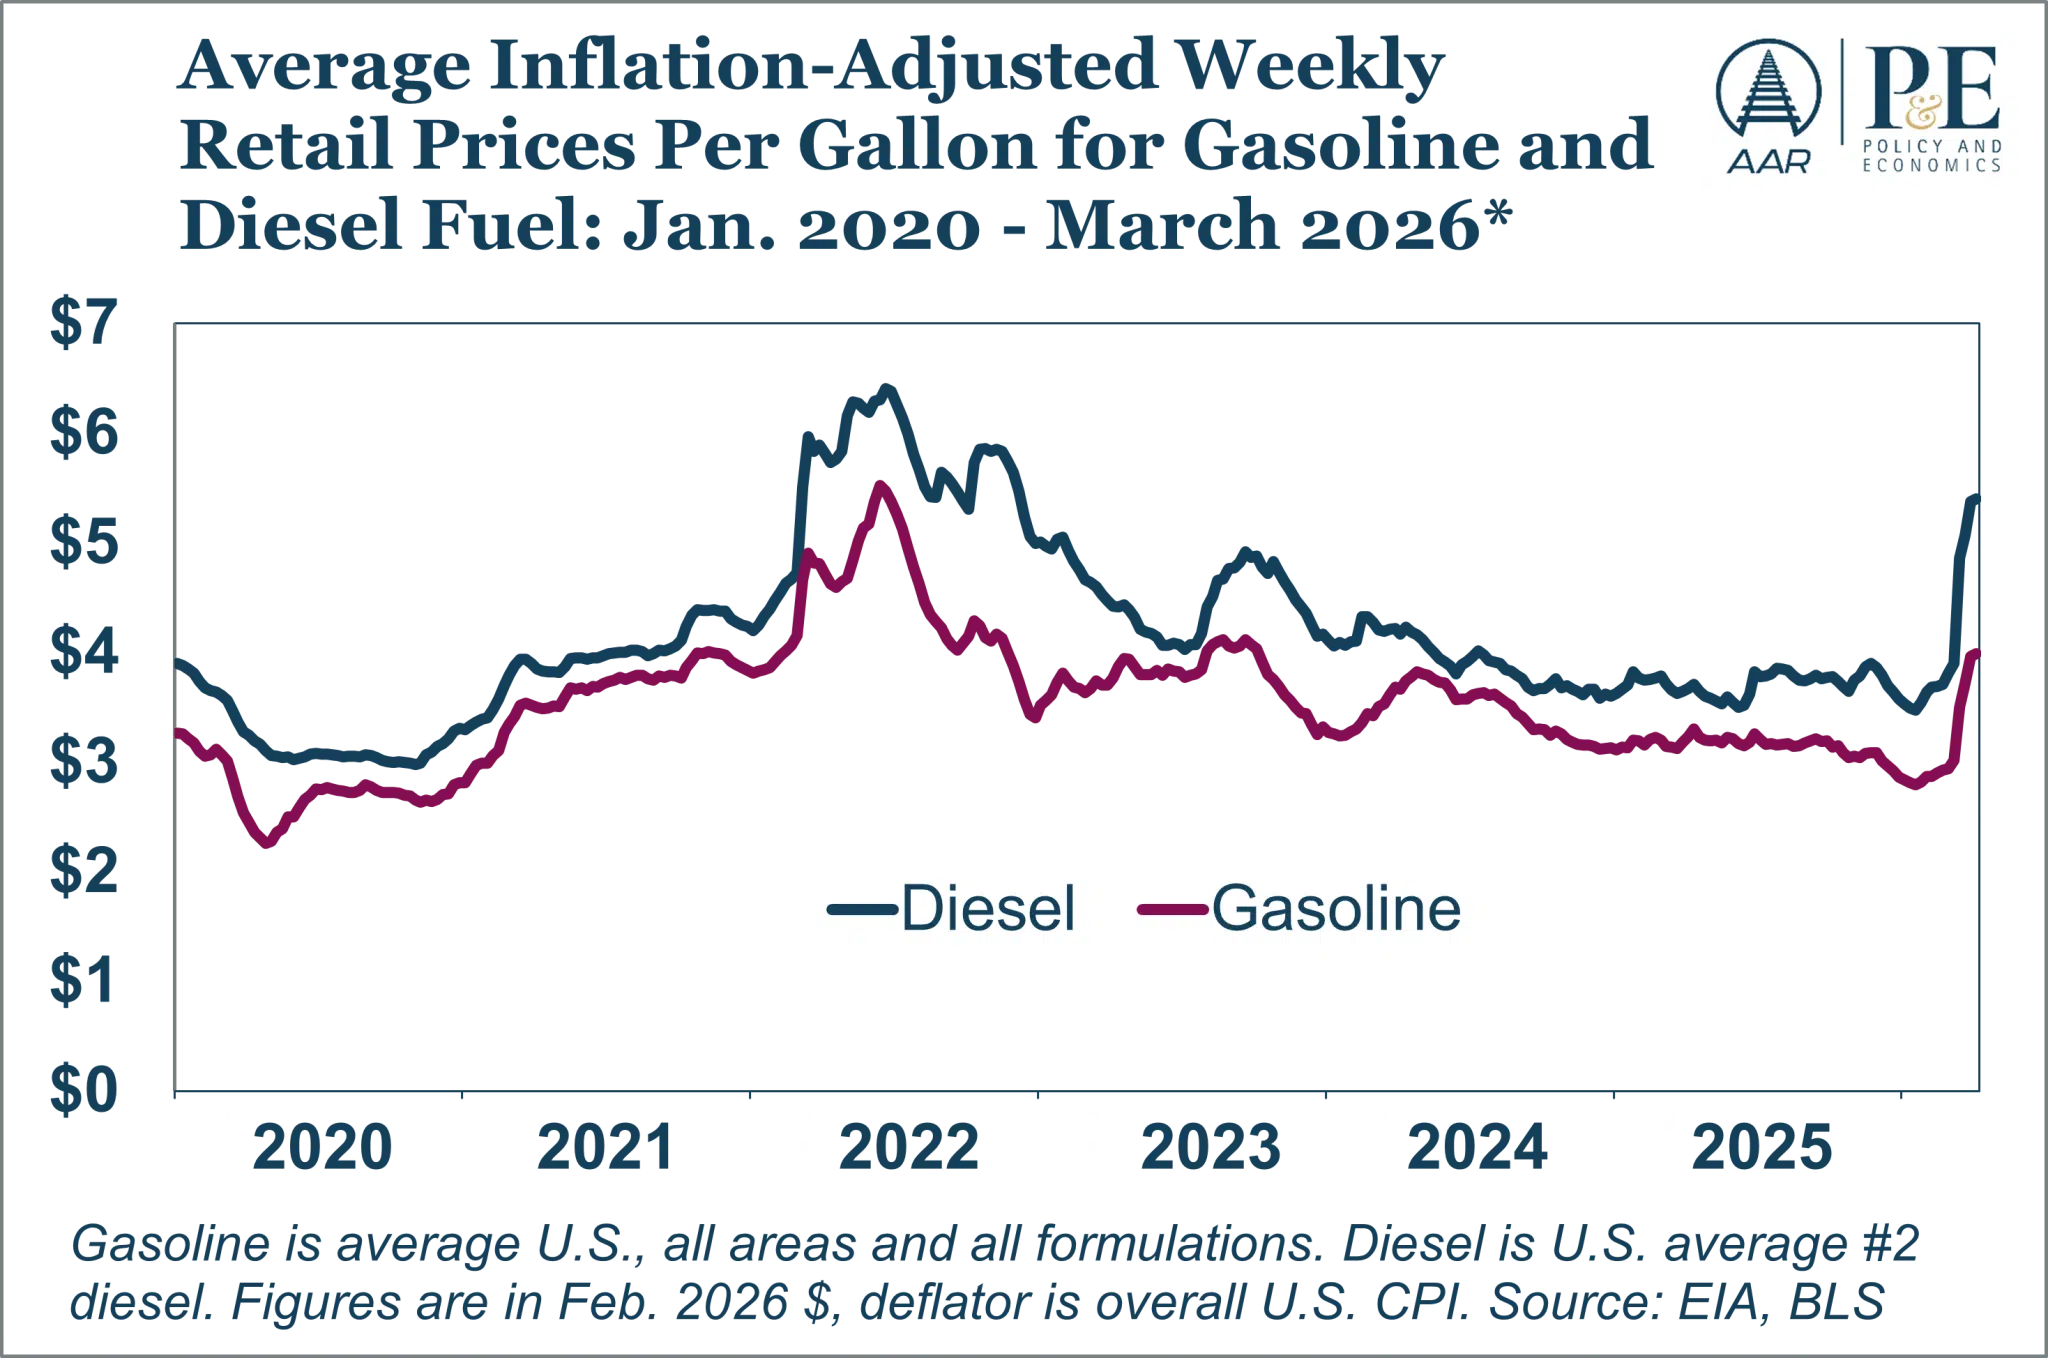
Inflation remains above the Federal Reserve’s target, and renewed geopolitical tensions, particularly in the Middle East, are reintroducing volatility into energy markets. Rising diesel prices feed directly into supply chains, creating cost pressure even when volumes are improving.
Labor market signals are increasingly mixed. Job growth has oscillated between gains and losses over the past year, with March’s preliminary 178,000 job increase following a sharp February decline. Wage growth continues to support spending, but a prolonged period of flat employment could eventually weigh on goods demand.
Consumer spending has held up, though growth is modest and goods spending has softened. For rail, any sustained slowdown would likely surface first in intermodal volumes.
Bottom Line: Momentum with Conditions Attached
Rail traffic is sending a clear message: the freight economy has regained momentum, and that momentum is broad, not fragile.
But rail is also signaling discipline. Volumes are improving even as inflation, energy costs, and labor dynamics remain unresolved. That combination points to an economy that is rebalancing, neither overheating nor stalling.
For now, the data point to an economy that is regaining balance rather than one flirting with excess or contraction. Momentum is visible, but conditional, shaped by energy markets, inflation dynamics, and labor trends still in flux. As these forces evolve, rail traffic will continue to provide one of the clearest early reads on whether growth is firming or merely pausing.