
RIO is a free monthly publication that provides insights from our economists into what rail traffic says about today’s economy and where the data suggests it could be headed. As part of RIO, the Freight Rail Index (FRI) tracks movement across the most economically sensitive rail traffic commodities.
You can find the full report each month on this webpage, with past editions available as PDFs at the bottom of the page. You can sign up for our email newsletter above to have RIO delivered directly to your inbox. For a deeper analysis, subscribe to our Rail Time Indicators (RTI) report.
Find past edition PDFs at the bottom of this page.
May 2026 Key Takeaways
- Freight Growth Is Broad-Based. Sixteen of twenty carload categories rose in April, pointing to strengthening goods demand across multiple sectors.
- Intermodal Remains Strong. Volumes rose for a third straight month, reinforcing continued resilience in imports, consumer goods demand, and containerized trade flows.
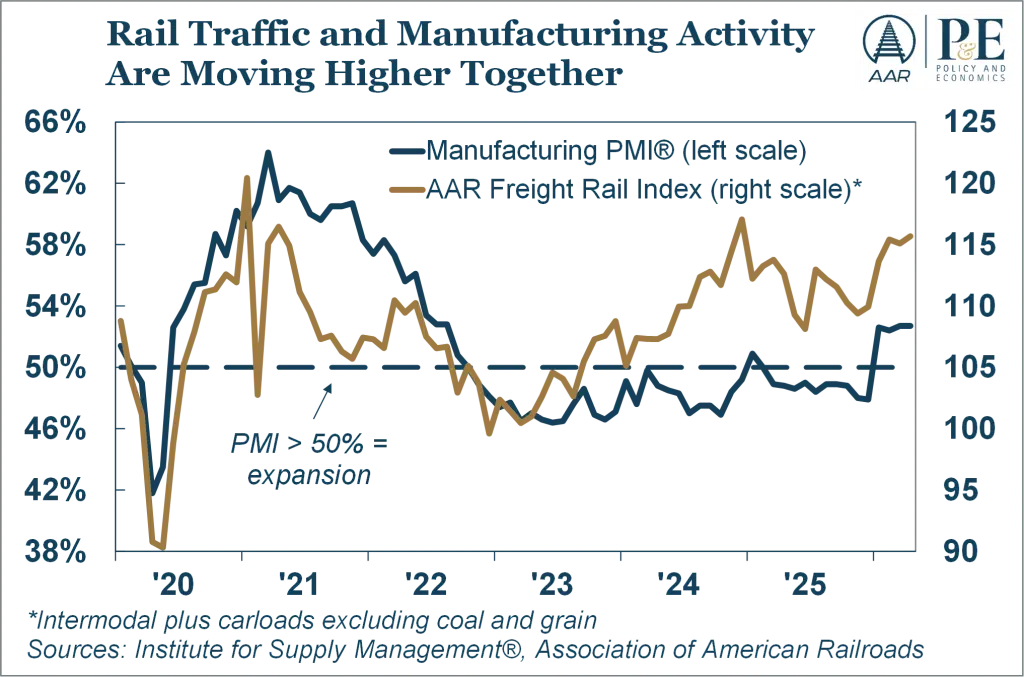
- Manufacturing Activity Is Improving. The ISM Manufacturing PMI® remained above 50% for a fourth consecutive month, signaling renewed industrial expansion.
- The Economy Remains Resilient but Uneven. Consumer spending continues to hold up, though inflation volatility and mixed labor market signals continue to cloud the outlook.
What Rail Data Are Saying About the U.S. Economy
Rail traffic often provides one of the earliest signals of shifts across production, trade flows, inventories, and supply chains. This month’s data continue to suggest the goods side of the economy is holding up better than many broader narratives imply.
After a strong March, rail volumes strengthened again in April, with gains across agricultural products, chemicals, intermodal, and several industrial categories. That breadth matters because rail traffic often reflects shifts in production, trade, inventories, and supply chains before they become fully visible in broader economic data.
This is not an economy surging out of recession. Growth remains uneven, sentiment remains fragile, and inflation volatility continues to cloud the outlook. But rail volumes increasingly suggest the goods side of the economy is doing more than simply stabilizing. In several areas, momentum is quietly improving.
The Freight Economy Is Quietly Firming
Several April indicators reinforce that view. The key point is not simply that volumes are rising, but that the improvement is becoming increasingly broad-based.
- Total carloads posted a fourth straight year-over-year gain and reached their strongest April level since 2019.
- Sixteen of twenty carload categories increased in April, pointing to unusually broad-based freight strength.
- Intermodal volumes rose for a third consecutive month and recorded one of the strongest April readings on record, reinforcing continued resilience in containerized trade and consumer-related freight demand.
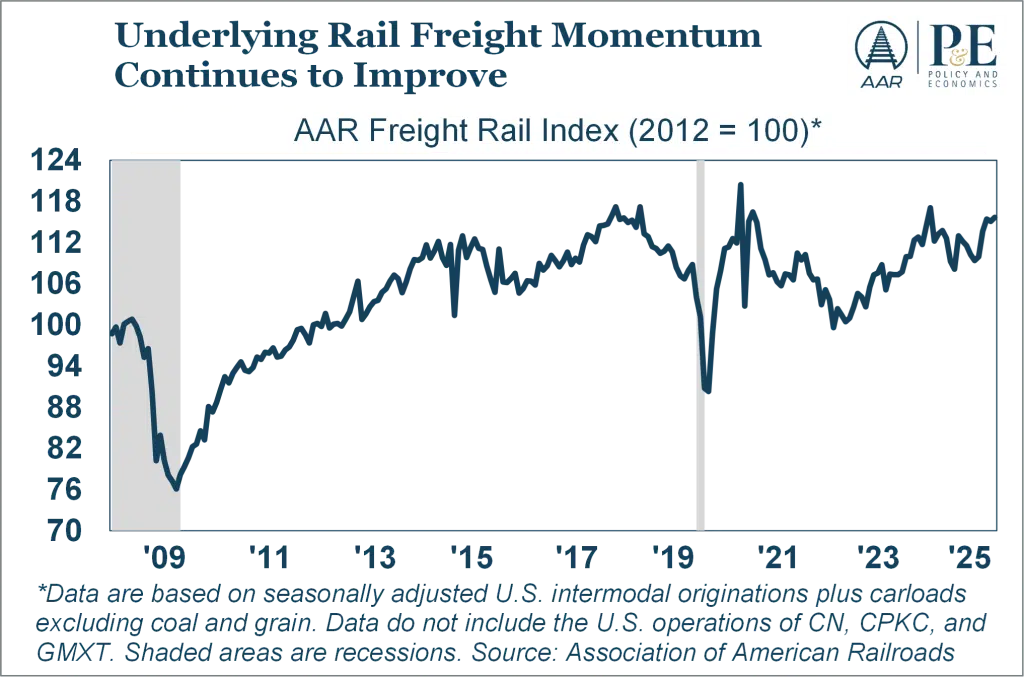
- The AAR Freight Rail Index (FRI), which excludes coal and grain to better capture underlying freight momentum, rose to its highest level in 16 months, reinforcing broader signs of improving goods-sector momentum.
The composition of the gains matters as much as the gains themselves. Much of the recent strength is coming from sectors tied to industrial production, exports, agriculture, and supply chain replenishment. That mix matters because it tends to reflect underlying economic activity more directly than sentiment surveys alone.
Agriculture Continues to Lead
Agricultural traffic remains one of the clearest sources of strength in the rail network and an important signal for both export demand and domestic processing activity.
Grain carloads continued to rise in April, supported by stronger exports of corn, wheat, and soybeans. Grain mill products also remained strong, reflecting continued demand tied to livestock feed, soybean crushing, ethanol production, and food manufacturing.
Together, these trends suggest agricultural demand remains supported by durable export and domestic processing activity rather than temporary market distortions.
Chemicals Reflect Broader Industrial Resilience
Chemical traffic continues to provide one of the strongest signals of underlying industrial activity within the U.S. economy.
Rail chemical shipments reached near-record levels again in April, supported by steady manufacturing demand, favorable petrochemical production economics, and continued activity across construction, packaging, and agricultural markets.
More broadly, chemical volumes continue to suggest that industrial activity remains firmer than broader economic sentiment might suggest.
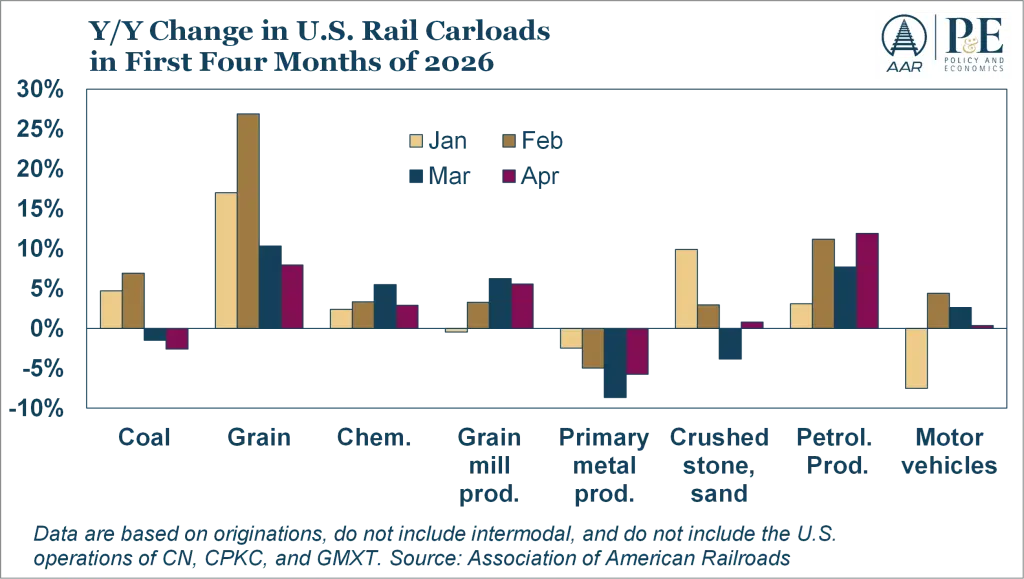
Coal Weakness Remains Structural
Coal and steel remained the main soft spots in April rail volumes.
Coal traffic continues to face longer-term structural pressure tied to changes in the U.S. energy mix, even as seasonal factors can still create short-term volatility.
Steel-related traffic was more mixed. Finished steel shipments remained weak, partly reflecting lower imports, but stronger scrap volumes suggest domestic steel production remains relatively resilient.
More broadly, the divergence across coal and steel categories reinforces how uneven the industrial economy remains beneath the surface.
Manufacturing Is Quietly Improving
Perhaps the most important development for freight markets has been the gradual improvement in manufacturing activity.
After spending much of the past three years in contraction territory, the ISM Manufacturing PMI® has now remained above 50% throughout 2026, signaling renewed industrial expansion.
That matters for railroads because manufacturing activity directly supports freight categories tied to chemicals, metals, forest products, and construction materials. The stabilization in manufacturing is particularly important because freight demand across several rail-served sectors weakened materially during the industrial slowdown of the past two years.
More broadly, the macroeconomic backdrop continues to support freight demand, though not without growing areas of uncertainty.
The labor market continues to hold up, though underlying indicators remain volatile and lack a clear trend. Inflation pressures also resurfaced in March, driven largely by energy prices, contributing to weaker consumer sentiment readings.
Yet actual spending behavior continues to hold up better than surveys imply. Consumer spending remained positive year over year, including continued growth in goods spending, a key driver of rail intermodal demand.
Overall, rail data continue to point to an economy that remains more resilient than many headline narratives suggest. Manufacturing activity is improving, goods demand remains positive, and freight flows across several core rail markets continue to strengthen.
Risks remain, particularly around inflation and labor market volatility. But beneath the noise, rail traffic continues to point to a goods economy entering the summer with genuine underlying momentum.