
RIO is a free monthly publication that provides insights from our economists into what rail traffic says about today’s economy and where the data suggests it could be headed. As part of RIO, a new Freight Rail Index (FRI) tracks movement across the most economically sensitive rail traffic commodities.
You can find the full report each month on this webpage, with past editions available as PDFs at the bottom of the page. You can sign up for our email newsletter above to have RIO delivered directly to your inbox. For a deeper analysis, subscribe to our Rail Time Indicators (RTI) report.
Find past edition PDFs at the bottom of this page.
January 2026 Key Takeaways
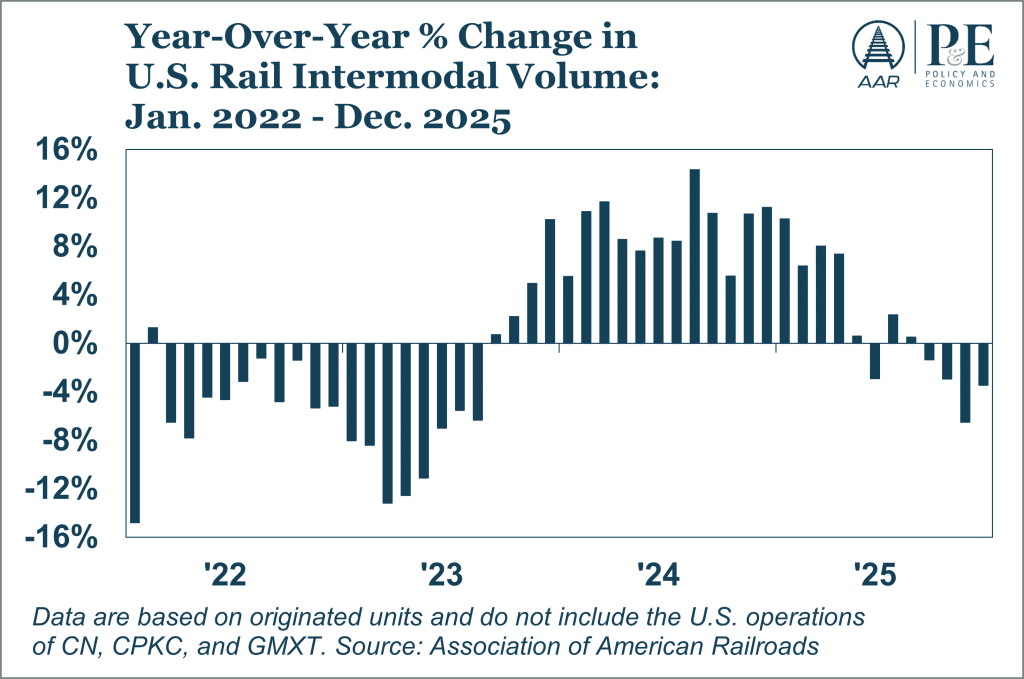
- Intermodal Softening.U.S. rail intermodal volume fell 3.4% in December 2025 from December 2024, the fourth consecutive month of year-over-year intermodal decline.
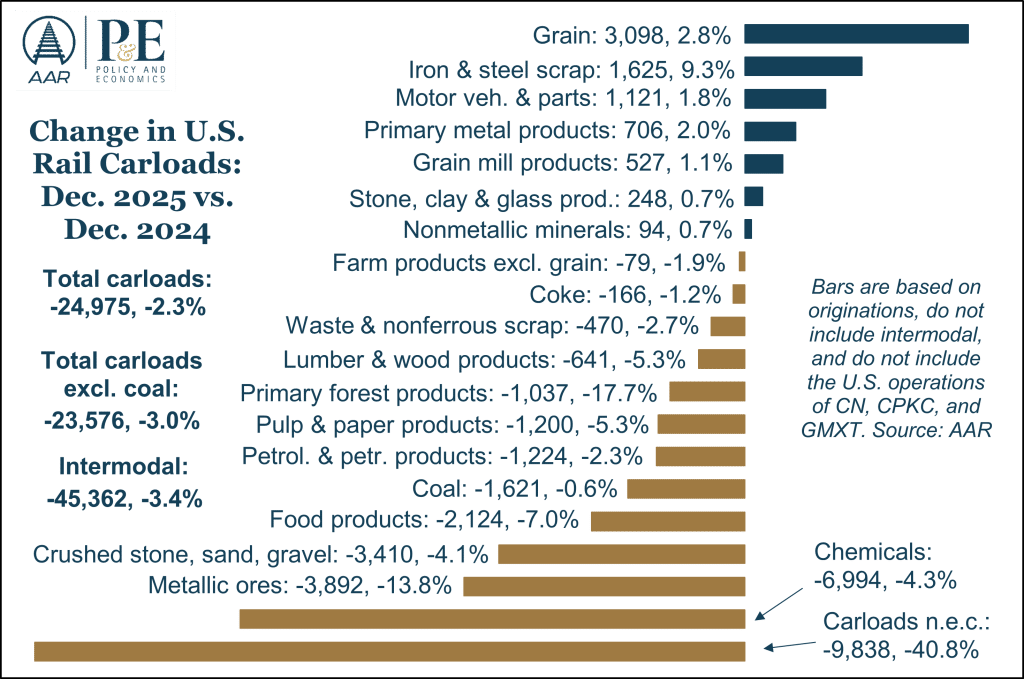
- Carload Counterbalance. In December, total year-over-year carloads fell 2.3%. Gains in grain, steel, and autos were offset by declines in chemicals, ores, and crushed stone and sand.
- Manufacturing Contraction. The Manufacturing PMI® in December was again below 50%, signaling continued manufacturing contraction.
- Moderate Growth. In 2025, carloads plus intermodal grew 1.5% over 2024, down from 3.4% in 2024. Growth in 2026 will depend largely on how well consumer spending holds up, which in turn will be impacted by whether the labor market softens.
Cautious Optimism for 2026?
Throughout 2025 there were persistent claims that a broad U.S. economic downturn was imminent. That didn’t happen. In fact, the most recent official numbers say U.S. GDP rose 4.3% in Q3 2025 over Q2 2025, the fastest quarterly growth rate in two years.
Nothing is certain, but most economists expect the U.S. economy to continue to grow moderately in 2026, supported by consumer spending and business investment. In addition, tariff rollbacks and improved trade relations have eased supply chain pressures. These tailwinds come even as the labor market remains tepid; as inflation, while trending lower, remains above the Federal Reserve’s target rate of 2%; and as manufacturing sluggishness endures.
This nuanced backdrop has parallels in rail freight trends. Intermodal volumes softened in the second half of 2025 after an earlier import surge, but resilient consumer spending and tightening trucking capacity could support intermodal growth in 2026.
On the carload side, volatility that characterized 2025 is likely to persist. Coal, grain, and chemicals will try to build on 2025’s gains, while categories that struggled in 2025 — such as metallic ores, lumber, and paper — will look to recover. Rail freight and the economy enter 2026 on a similar footing: seemingly stable overall, but with underlying vulnerabilities that could disrupt growth.
Mixed End to 2025 in Rail Volumes
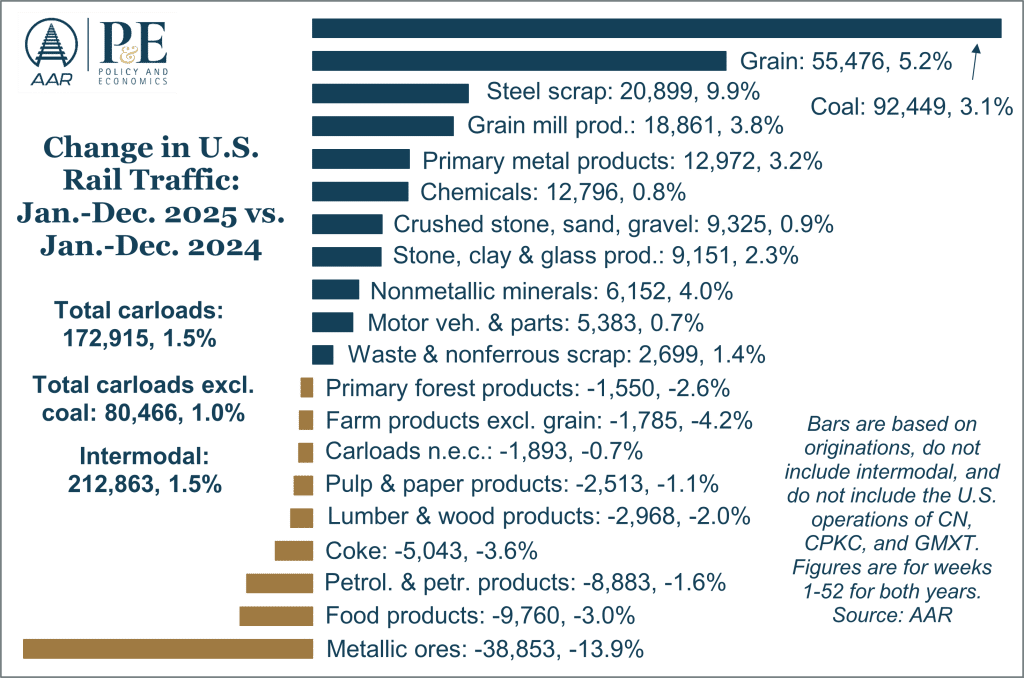
Total U.S. rail carloads fell 2.3% in December 2025 from December 2024, their third year-over-year decline in the final four months of 2025. Seven of the 20 major carload categories the AAR tracks saw gains in December, led by grain, steel-related products, and autos. For all of 2025, total carloads were up 1.5% over 2024, their biggest percentage gain since a 6.6% gain in 2021. Sluggish U.S. manufacturing output helps explain why rail carload growth was relatively muted in 2025. To the extent output remains sluggish in 2026, rail carload volumes will remain under pressure.
Meanwhile, year-over-year U.S. rail intermodal shipments fell 3.4% in December, their fourth straight year-over-year decline but an improvement over November’s 6.5% decline. For all of 2025, U.S. intermodal volume was 14.06 million containers and trailers, up 1.5%, or nearly 213,000 units, over 2024 and the second most ever (behind 2018’s 14.36 million). U.S. rail container volume in 2025 was 13.65 million units, up 2.4% over 2024 and the most ever for a year.
Rail intermodal shipments are closely tied to consumer spending, whose growth in 2026 will hinge on factors like inflation-adjusted income growth, disposable income, labor market stability, and interest rates. If inflation eases and borrowing costs fall, households will have more room for big-ticket and discretionary purchases, boosting retail activity and intermodal freight. Conversely, elevated interest rates or weaker job growth could tighten budgets and curb demand, leaving railroads with muted gains in consumer-driven intermodal traffic.

Key Rail Commodities Were Mixed in December
Freight Rail Index
The AAR Freight Rail Index (FRI), which tracks seasonally adjusted intermodal shipments and carloads excluding coal and grain, is a useful gauge of economy-sensitive rail volumes. The index slipped slightly in December, its seventh decline in nine months, and was 6.3% below its year-earlier level. The recent decline in the FRI is driven mainly by a slowdown in intermodal traffic.

Coal
In 2025, coal accounted for 26.3% of U.S. non-intermodal rail volume, down from nearly 50% at its peak in 2009 as U.S. coal-fired power generation has plunged to about half its level of 10 years ago and a third of its level of 20 years ago. Coal’s fortunes improved slightly in 2025: its share of U.S. electricity generation rose to about 16.7% from 15.2% in 2024, largely due to higher natural gas prices. Rail coal carloads followed suit, up 3.1% (more than 92,000 carloads) over 2024.
In December 2025, the Energy Information Administration predicted that U.S. coal production in 2026 would fall 2.2% from 2025 and U.S. coal consumption would fall 4.7%. Factors that could impact the coal market include fuel-cost dynamics (such as an increase or decline in the price of natural gas), federal or state-level interventions (such as delaying plant retirements or easing environmental regulations on coal-fired power plants), and whether the coal export market accelerates.
Carloads Excluding Coal
U.S. carloads excluding coal fell 3.0% in December 2025 from December 2024, only their third year-over-year decline in the 12 months of 2025 and only their fourth in the 24 months since January 2024. Carloads for all of 2025 were up 1.0% over 2024, following a 1.4% gain in 2024 and a 1.0% gain in 2023. Those increases were modest largely because underlying industrial and manufacturing activity grew slowly, limiting demand for raw materials and intermediate goods that drive rail carloads. Still, carloads excluding coal in 2025 (8.48 million) were the most since 2019.
Grain
U.S. carloads of grain were up 2.9% in December 2025 over December 2024, their 10th year-over-year increase in 2025 and their 21st in the 24 months since January 2024. For the full year 2025, U.S. grain carloads totaled 1.12 million, up 5.2% (more than 55,000 carloads) over 2024 and the most since 2021. U.S. grain carloads were higher in 2025 mainly because U.S. grain exports were higher. If grain exports rise in 2026, grain carloads will probably rise too; if grain exports fall, there’s a good chance rail carloads of grain will fall as well. In 2025, grain accounted for 9.8% of U.S. non-intermodal rail volume, close to a record high.
Chemicals
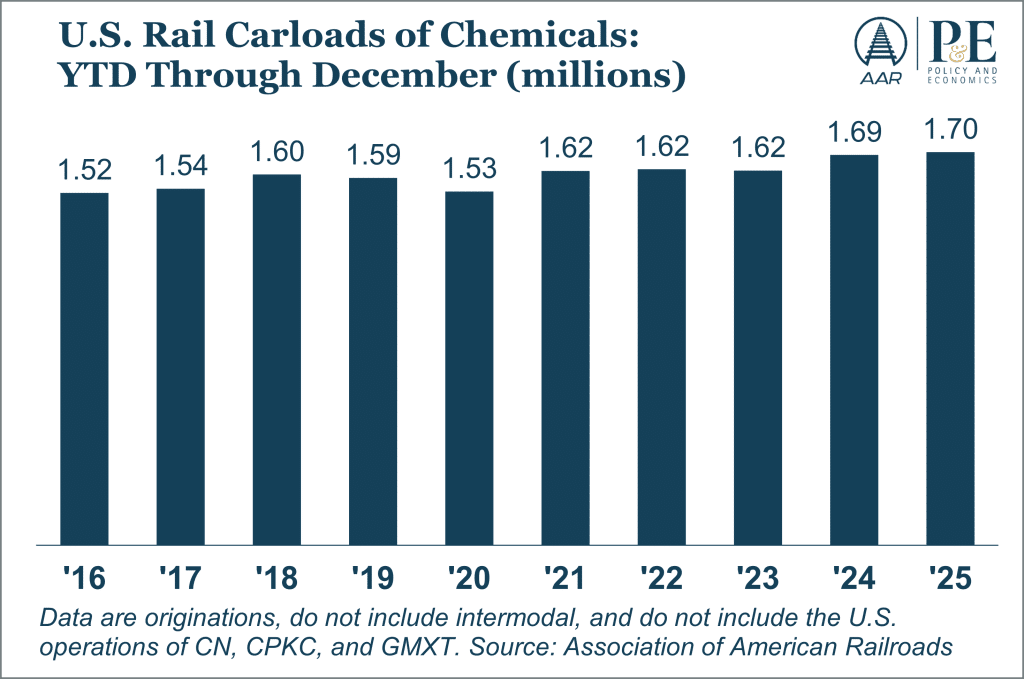
U.S. carloads of chemicals finished 2025 on a down note, falling 4.3% in December from a year earlier and 1.3% in Q4 — their first quarterly decline since Q2 2023. For the year, U.S. chemical carloads totaled 1.70 million, up 0.8% from 2024 and the most ever, thanks to gains earlier in the year.
The recent drop reflects headwinds: higher natural gas prices raised input costs, weak housing cut demand for construction-related chemicals, auto-sector uncertainty dampened coatings and polymers, and global softness weighed on exports. Early 2026 may remain soft if housing and auto demand stay subdued and trade uncertainty persists, though easing gas prices would offer some relief.
Steel-Related Products
U.S. carloads of primary metal products (mainly steel) rose 2.0% in December, their ninth year-over-year increase in the last ten months. Carloads averaged 7,149 per week in December. Carloads for all of 2025 were up 3.2% over 2024. Carloads of iron and steel scrap rose 9.2% in December, their tenth straight year-over-year increase. They were up 9.9% for the year. Scrap carloads totaled 232,368 in 2025, the most since 2008. North American carloads of metallic ores, which include shipments by Canadian railroads that are major metallic ore transporters, were down 11.9% in 2025; carloads of 807,099 were the fewest in AAR records, which for North America volume begin in 2020.
Uncertainty Everywhere: What’s Next for the Economy?
The Labor Market: Up or Down?
A preliminary 50,000 net new jobs were created in December 2025, compared to 56,000 in November. The unemployment rate in December was 4.4%, down from 4.5% in November. Initial claims for unemployment insurance, an early warning system for labor market health, averaged 219,000 in December, below the average for all of 2025 (226,000) and 2024 (223,000). However, hiring remains constrained as well.
The average number of persons who filed weekly continuing claims for unemployment insurance in December (1.89 million) was only slightly lower than in other recent months, and November’s “hiring rate” (the number of hires in a month divided by total employed — it’s a measure of how quickly employers are adding employees) was the lowest since September 2012 (not including the pandemic month of April 2020). Labor market health is crucial to overall economic health because of its impact on consumer spending, which accounts for roughly two-thirds of the U.S. economy. As they say, when consumer spending sneezes, the U.S. economy catches a cold.
Fed Raises Interest Rates Again
The Federal Reserve closed 2025 with three consecutive quarter-point rate cuts, bringing the federal funds target range to 3.50–3.75%, its lowest level since fall 2022. These rate cuts reflect growing concern over a cooling labor market (unemployment has been trending higher in recent months) even as inflation remains above the Fed’s 2% goal.
The Fed’s dual mandate of price stability and maximum employment is pulling Fed policymakers in opposite directions. Looking ahead, the Fed will proceed cautiously. Further easing is possible if job growth falters, but inflation risks will keep cuts measured. With a transition to a new Fed chair looming in May and global uncertainties unresolved, expect the Fed to adopt a data-driven approach that prioritizes flexibility over bold moves.
For railroads, lower interest rates can support industrial activity and capital spending, which in turn would benefit rail volumes tied to manufacturing and construction. On the other hand, high inflation presents significant challenges for railroads. It can raise operating costs for fuel, labor, and equipment while eroding consumer purchasing power and slowing industrial activity — both of which reduce freight demand. For railroads and other firms, inflation also makes capital projects more expensive and can pressure customers to resist rate increases, limiting the ability to pass through higher costs.
Manufacturing Still Contracting
The ISM Manufacturing PMI®, which measures the health of the U.S. manufacturing sector, fell to 47.9% in December, its lowest level in 14 months and the 36th month in the past 38 that it’s been below 50%, signaling contraction. The new orders sub-index in December was 47.7%, suggesting no quick turnaround. Meanwhile, Federal Reserve data show manufacturing output has risen slightly in recent months but not nearly enough to offset declines in 2023 and 2024.
As noted above, to the extent U.S. manufacturing remains sluggish in 2026, rail volumes will remain under pressure. The outlook for 2026 hinges on several variables: trade policy, with tariffs and global uncertainty shaping supply chains; interest rates, where lower borrowing costs could spur investment; and technology adoption, as automation and AI should yield efficiency gains despite implementation hurdles.
Federal incentives and supply-chain security may accelerate on-shoring and near-shoring, partly offsetting weakness elsewhere. For freight railroads, growth depends on rebounds in core markets like autos and construction. A stronger investment cycle or improved trade flows could lift carloads, while prolonged softness would keep traffic subdued.
Welcome Improvement in Services Activity
The ISM’s Services PMI®, which covers the much larger U.S. services sector, rose from 52.6% in November to 54.4% in December, its highest level in 14 months. The new orders subindex surged from 52.9% in November to 57.9% in December, a strong signal that expansion will continue. While railroads are more directly impacted by the manufacturing side of the economy, strength in services often signals broader economic strength that can indirectly support freight demand. The continued growth of the services sector explains why overall economic growth is positive even with stagnating manufacturing.

Goods Sector Outlook for 2026: Diverging Views and Rail Implications
An optimist would argue the goods-related side of the economy — what railroads care most about — is positioned for growth in 2026, supported by resilient consumer spending, renewed manufacturing investment, targeted reshoring and near-shoring efforts, and easing trade tensions.
A pessimist, however, sees a more challenging outlook, citing persistent inflation, an uncertain labor market, elevated interest rates, and uneven global trade as headwinds. Ultimately, rail traffic levels will be a function of which scenario takes hold, rising with stronger goods flows or stagnating if demand falters. In either case, thanks to capacity improvements and service enhancements, railroads are well positioned to support supply chain stability and reliability in 2026.